React for Data Visualization (with D3) - workshop by Swizec
reactd3workshop.com
Integrating D3 with React
You can read this segment in in 23 minutes. Solving the exercises might take longer.
This segment covers 👇
D3 is great out of the box. There's nothing inherently wrong with it at all. It's flexible and gets the job done. You don't need React nor any other library to create data visualizations.
So why use React? There's a few ways React makes your data visualization code even better.
Why
Declarative visualization
The idea behind declarative visualization is that you can focus on building your logic, not how to render something. Same as we discussed yesterday.
Take this animated alphabet for example. New letters animate in, old letters shuffle around, and dropped letters animate out. Each letter figures out how to do this on its own, you just render them in a loop.

class Alphabet extends React.Component {
    static letters = "abcdefghijklmnopqrstuvwxyz".split("");
    state = { alphabet: [] };

    componentDidMount() {
        d3.interval(this.shuffleAlphabet, 1500);
    }

    shuffleAlphabet = () => {
        const alphabet = d3
            .shuffle(Alphabet.letters)
            .slice(0, Math.floor(Math.random() * Alphabet.letters.length))
            .sort();

        this.setState({
            alphabet
        });
    };

    render() {
        let transform = `translate(${this.props.x}, ${this.props.y})`;

        return (
            <g transform={transform}>
                <TransitionGroup enter={true} exit={true} component="g">
                    {this.state.alphabet.map((d, i) => (
                        <Letter letter={d} index={i} key={d} />
                    ))}
                </TransitionGroup>
            </g>
        );
    }
}
ReactTransitionGroup has changed its API so the full example 👆 needs some updating, but the core idea remains: Letters handle transitions, you render in a loop.
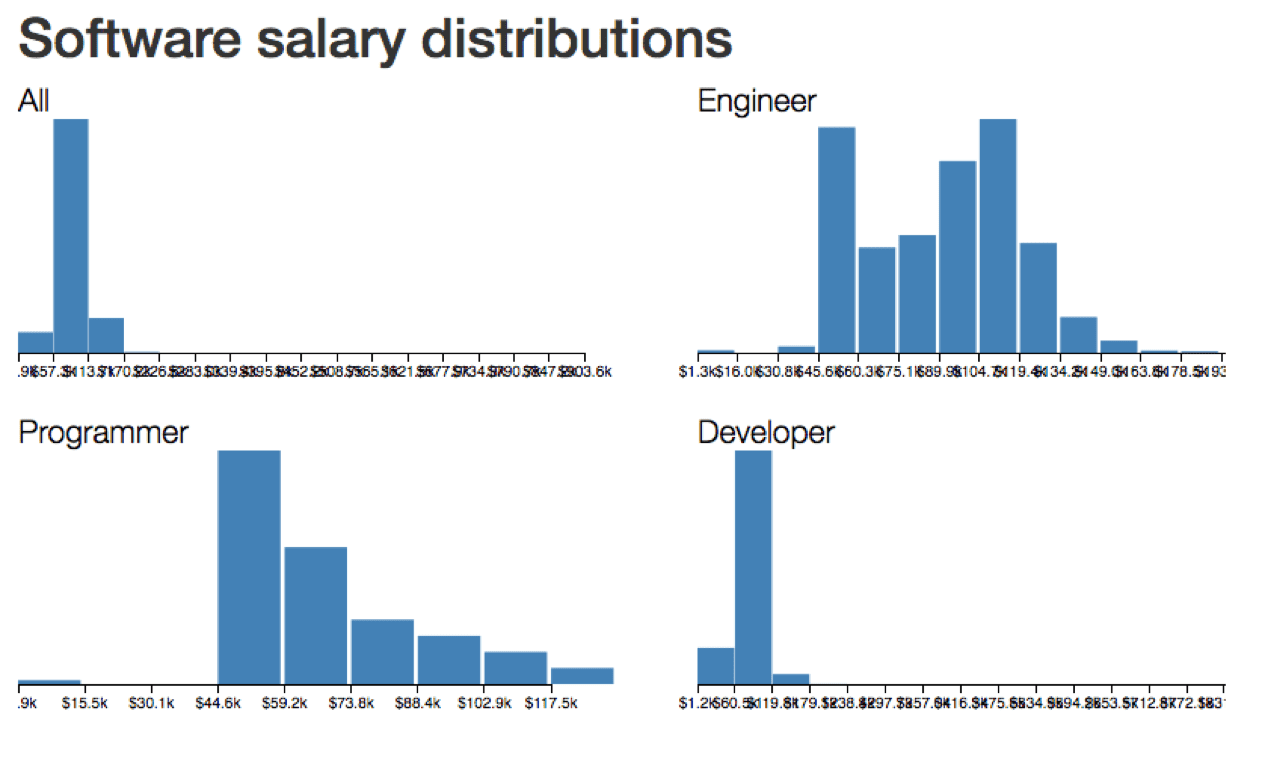
Reusable viz components
Now imagine you've built a <Histogram /> component. You can move it around just like you can a <Button /> component. Feed it different data, still a histogram.
class Dataviz extends Component {
    render() {
        return (
            <g transform={translate}>
                <Histogram
                    data={this.props.data}
                    value={d => d.base_salary}
                    x={0}
                    y={0}
                    width={400}
                    height={200}
                    title="All"
                />

                <Histogram
                    data={engineerData}
                    value={d => d.base_salary}
                    x={450}
                    y={0}
                    width={400}
                    height={200}
                    title="Engineer"
                />

                <Histogram
                    data={programmerData}
                    value={d => d.base_salary}
                    x={0}
                    y={220}
                    width={400}
                    height={200}
                    title="Programmer"
                />

                <Histogram
                    data={developerData}
                    value={d => d.base_salary}
                    x={450}
                    y={220}
                    width={400}
                    height={200}
                    title="Developer"
                />
            </g>
        );
    }
}
No more spaghetti

Using a library (and when not to)
The easiest way to achieve these benefits is to use a library. Something that comes with pre-built visualization components you can plug into your app and move on with life.
Most data visualization libraries are built on top of D3. They often give you basic charts and graphs, some customizability, and a world of pain when you stray from the beaten path.
That's why I rarely use them myself.
But if all you need is a simple chart, a library is your friend. Here are some of the most popular 👇
List borrowed from a wonderful Smashing Magazine article, because I like doing it myself from scratch 🤙
Victory
React.js components for modular charting and data visualization
Victory offers low level components for basic charting and reimplements a lot of D3's API. Great when you need to create basic charts without a lot of customization. Supports React Native.
Recharts
A composable charting library built on React components
Recharts looks similar to Victory. It comes with a pile of charting components, offers some customization, and seems to love animating everything by default.
Nivo
nivo provides a rich set of dataviz components, built on top of the awesome d3 and Reactjs libraries.

Nivo is another attempt to bring you a set of basic charting components. Comes with great interactive documentation, support for Canvas and API rendering. Allows a lot of basic customization.
VX
vx is collection of reusable low-level visualization components. vx combines the power of d3 to generate your visualization with the benefits of react for updating the DOM.
VX is the closest to the integration approaches we're going to discuss today. React for rendering, D3 for calculations. When you build a set of custom components for your organization, a flavor of VX is essentially what you come up with.
That's why I often recommend teams use VX when they need to get started quickly.
When not to use a library
Now, if you want to build something custom, something that delights and astounds, something that makes your users love you, then you will have to understand how combining React and D3 works under the hood. That's what we're here for today.
To quote Marcos Iglesias because I agree with everything he said.
Quality
Let’s say we fix quality. We could aim to have a code base that is well tested, up to date with D3.js and with comprehensive documentation.
Time
If we think about time, a useful question to ask ourselves is, “Is this a long-term investment?” If the response is “yes,” then I would advise you to create a library based on D3.js and wrap it with React using the lifecycle methods approach. This approach separates our code by technologies and is more time-resistant.
But leads to lower code quality and worse UI performance.
Scope
When we deal with scope, we should think of whether what we need is a small number of basic charts, a one-off complex visualization or several highly customized graphics. In the first case, I would again choose the closest library to the specifications and fork it. For bespoke data visualizations that contain a lot of animations or interactions, building with regular D3.js and React is the best option.
Cost
Finally, the cost side of the decision is related to the budget and training of the team. What kinds of skills does your team have? If you have D3.js developers, they would prefer a clear separation between D3.js and React, so probably an approach using the lifecycle method wrapping would work great. However, if your team is mostly React developers, they would enjoy extending any of the current React-D3.js libraries.
Fundamentally, the more custom your visualization needs to be, the more necessary it becomes to roll your own code.
How to build your own
Our visualizations are going to use SVG - an XML-based image format that lets us describe images in terms of mathematical shapes. For example, the source code of an 800x600 SVG image with a rectangle looks like this:
<svg width="800" height="600">
    <rect width="100" height="200" x="50" y="20" />
</svg>
These four lines create an SVG image with a black rectangle at coordinates (50, 20) that is 100x200 pixels large. Black fill with no borders is default for all SVG shapes.
SVG is perfect for data visualization on the web because it works in all browsers, renders without blurring or artifacts on all screens, and supports animation and user interaction. You can see examples of interaction and animation later in this book.
But SVG can get slow when you have many thousands of elements on screen. We're going to solve that problem by rendering bitmap images with canvas. More on that later.
React with SVG
Another nice feature of SVG is that it's just a dialect of XML - nested elements describe structure, attributes describe the details. The same principles that HTML uses.
That makes React's rendering engine particularly suited for SVG. Our 100x200 rectangle from before looks like this as a React component.
const Rectangle = () => <rect width="100" height="200" x="50" y="20" />;

ReactDOM.render(<Rectangle />, document.getElementById("svg"));
You're right. This looks like tons of work for a static rectangle. But look closely. Even if you know nothing about React and JSX, you can look at that code and see that it's a Picture of a Rectangle.
Compare that to a pure D3 approach:
d3
    .select("svg")
    .attr("width", 800)
    .attr("height", 600)
    .append("rect")
    .attr("width", 100)
    .attr("height", 200)
    .attr("x", 50)
    .attr("y", 20);
It's elegant, it's declarative, it looks like function call soup. It doesn't scream "Rectangle in an SVG" to me as much as the React example does.
You have to take your time and read the code carefully: first, we select the svg element, then we add attributes for width and height. After that, we append a rect element and set its attributes for width, height, x, and y.
Those 8 lines of code create HTML that looks like this:
<svg width="800" height="600">
    <rect width="100" height="200" x="50" y="20" />
</svg>
Would've been easier to just write the HTML, right? Yes, for static images you're better off using Photoshop or something then exporting to SVG.
Either way, dealing with the DOM is not D3's strong suit. There's a lot of typing, code that's hard to read, it's slow when you have thousands of elements, and it's often hard to keep track of which elements you're changing. D3's enter-update-exit cycle is great in theory, but I personally never found it easy to use.
If you don't know what I just said, don't worry. We'll cover the enter-update-exit cycle in the animations example. Don't worry about D3 either. I know it's hard. I've written two books about it, and I still spend as much time reading the docs as writing the code. There's much to learn, and I'll explain everything as we go along.
D3's strong suit is its ability to do everything other than the DOM. There are many statistical functions, great support for data manipulation, and a bunch of built-in data visualizations. D3 can calculate anything for us. All we have to do is draw it out.
The basic idea
Which is why we're going to follow this approach:
- React owns the DOM
- D3 calculates properties
This way, we can leverage React for SVG structure and rendering optimizations and D3 for all its mathematical and visualization functions.
Now let's look at two different ways to put them together: blackbox and full-feature.
Blackbox components
Let's build an axis component. Axes are the perfect use-case for blackbox components. D3 comes with an axis generator bundled inside, and they're difficult to build from scratch.
They don't look difficult, but there are many tiny details you have to get just right.
A quick blackbox example - a D3 axis
D3's axis generator takes a scale and some configuration to render an axis for us. The code looks like this:
If this code doesn't make any sense, don't worry. There's a bunch of D3 to learn, and I'll help you out. If it's obvious, you're a pro! This workshop will be much easier to follow.
We start with a linear scale that has a domain [0, 10] and a range [0, 200]. You can think of scales as mathematical functions that map a domain to a range. In this case, calling scale(0) returns 0, scale(5) returns 100, scale(10) returns 200. Just like middle school mathematics.
We create an axis generator with axisBottom, which takes a scale and is going to generate a bottom oriented axis – numbers below the line. You can also tweak settings for the number of ticks, their sizing, and their spacing.
Equipped with an axis generator, we select the svg element, append a grouping element, use a transform attribute to move it 10px to the right and 30px down, and invoke the generator with .call().
A quick blackbox example - a React+D3 axis
Now let's say we want to use that same axis code but as a React component. The simplest way is to use a blackbox component approach like this:
Manual version
Oh man! So much code! Is this really worth it? Yes, for the other benefits of using React in your dataviz. You'll see :)
We created an Axis component that extends React base Component class. We can't use functional stateless components for this because we need lifecycle hooks. More on those later.
Our component has a render method, which returns a grouping element (g) moved 10px to the right and 30px down using the transform attribute. Same as before.
We created a React Ref using this.gRef = React.createRef() and added it to our render via the ref attribute. This gives us an easy to use reference to the raw DOM node.
The body of d3render should look familiar. It's where we put code from the pure D3 example. Scale, axis, select, call. There's no need to append a grouping element; we're already there with this.gRef.current.
For the manual re-rendering part, we call d3render in componentDidUpdate and componentDidMount. This ensures that our axis re-renders every time React's engine decides to render our component. On state and prop changes usually.
That wasn't so bad, was it?
Practical exercise
To make our axis more useful, we could get the scale and axis orientation from props. Perhaps even a label!
Try that as an exercise. Here's my solution 👇
HOC version
After the blackbox axis example above, you'd be right to think something like "Dude, that looks like it's gonna get hella repetitive. Do I really have to do all that every time?"
Yes, you do. But! We can make it easier with a higher order component - a HOC.
Higher order components are one of the best ways to improve your React code. When you see more than a few components sharing similar code, it's time for a HOC. In our case, that shared code would be:
- rendering an anchor element
- calling D3's render on updates
With a HOC, we can abstract that away into something called a class factory. It's an old concept coming back in vogue now that JavaScript has classes.
You can think of it as a function that takes some params and creates a class – a React component. Another way to think about HOCs is that they're React components wrapping other React components and a function that makes it easy.
Let's build a HOC for D3 blackbox integration.
A D3blackbox HOC looks like this:
You'll recognize most of that code from earlier. We have componentDidMount and componentDidUpdate lifecycle hooks that call D3render on component updates. Render renders a grouping element as an anchor into which D3 can put its stuff.
Because D3render is no longer a part of the component, we have to use .call to give it the scope we want: this class, or rather this instance of the React component.
We've also made some changes to make render more flexible. Instead of hardcoding the translate() transformation, we take x and y props. { x, y } = this.props takes x and y out of this.props using object decomposition, and we used ES6 string templates for the transform attribute.
Consult my ES6 cheatsheet for details on that.
Using our new D3blackbox HOC to make an axis looks like this:
const Axis = D3blackbox(function() {
    const scale = d3
        .scaleLinear()
        .domain([0, 10])
        .range([0, 200]);
    const axis = d3.axisBottom(scale);

    d3.select(this.anchor.current).call(axis);
});
It’s the same rendering code as we had before. The only difference is that the function is wrapped in a D3blackbox call. This turns it into a React component.
You can play with this example on CodeSandbox, here.
Practical exercise
Use the D3blackbox approach to take a random D3 example and render it as a React component.
Let's say the barchart example from earlier. You can use this link for the data file.
Fork the d3-axis-hoc CodeSandbox and have some fun :)
Due to D3 version changes you'll have to tweak how that bar chart loads data. D3v5 moved to using promises by default, so you have to replace d3.csv(url, callback) with d3.csv(url).then.
Here's my solution 👉 click
Open source D3blackbox library
You can avoid building your own by using my opensourced solution. It's called D3blackbox and works the same as what you just learned.

You use it like this 👇
The useD3 hook
React 16.8 introduced a new way of thinking about state and side-effects in React. Using hooks we can do everything with functional components. No more lifecycle methods, just effects and side-effects.
It's pretty neat. We'll talk more about it later.
Right now I want to show you what a hook version of d3blackbox looks like. Comes bundled with my open source library :)
import { useD3 } from "d3blackbox";
function renderSomeD3(anchor) {
    d3.select(anchor);
    // ...
}
const MyD3Component = ({ x, y }) => {
    const refAnchor = useD3(anchor => renderSomeD3(anchor));
    return <g ref={refAnchor} transform={`translate(${x}, ${y})`} />;
};
Same mental model applies as before. You have a D3 render function that handles all the rendering. Takes over the DOM and does its thing.
The difference is that instead of wrapping our whole component in D3blackbox and rendering an anchor element with a HOC, we are now rendering the anchor itself and giving it a ref that useD3 creates for us.
This is the hook:
export const useD3 = function(render) {
    const refAnchor = React.useRef(null);

    React.useEffect(() => {
        render(refAnchor.current);
    });

    return refAnchor;
};
🤘
Using it is even easier than the HOC version. I ❤️ hooks.
Practical exercise
Try the useD3 hook with your earlier CodeSandbox integrating a barchart.
Full-feature integration
As useful as blackbox components are, we need something better if we want to leverage React's rendering engine. The blackbox approach especially starts struggling when it comes to scale. The more charts and graphs and visualizations on your screen, the slower it becomes.
Someone once came to my workshop and said "We used the blackbox approach and it takes several seconds to re-render our dashboard on any change. I'm here to learn how to do it better."
In our full-feature integration, React does the rendering and D3 calculates the props.
Our goal is to build controlled components that dutifully listen to their props and reconcile that with D3's approach that uses a lot of internal state.
There are two situations we can find ourselves in:
- We know for a fact our component's props never change
- We think props could change
It's easiest to show you with an example.
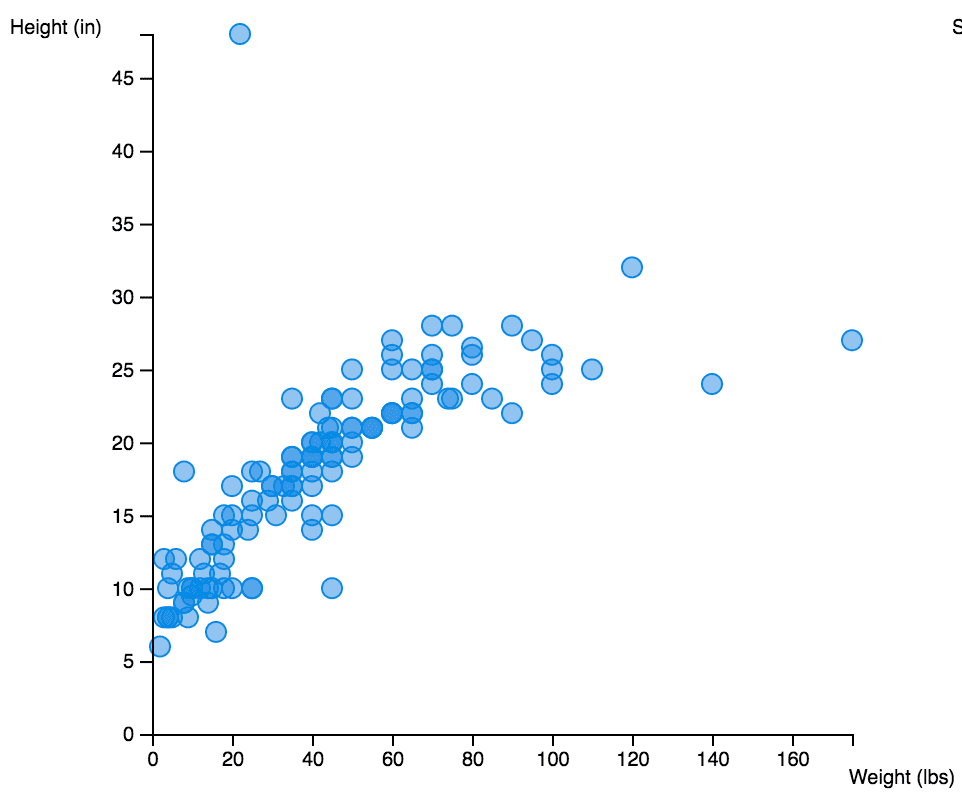
Let's build a scatterplot step by step. Take a random array of two-dimensional data, render in a loop. Make magic.
Something like this 👇
Props don't change
The first case makes our life easier, but our component less flexible and reusable. It's great when you know in advance that there are features you're not going to support.
Like, filtering your data or changing component size 👉 means your D3 scales don't have to change.
When our props don't change, we follow a 2-step integration process:
- set up D3 objects as class properties
- output SVG in
render()
We don't have to worry about updating D3 objects on prop changes. Work done 👌
Practical exercise
Build scatterplot together assuming no updates, use a live codesandbox.
Steps to follow 👇
- stub out the basic setup
- generate random data
- set up D3 scales
- render circles for each entry
- add axes
Props might update
When our props might update, the story is a little different. Since we're using D3 objects to calculate our SVG properties, we have to make sure those objects are updated before we render.
If you do it in componentDidUpdate, you will render a stale visualization.
We follow a 3-step pattern:
- set up D3 objects in component state
- update D3 objects in
getDerivedStateFromProps - output SVG in
render()
getDerivedStateFromProps is the new lifecycle hook that replaces componentWillX that we used to have. Officially discouraged, it is the best tool we have to make sure D3 state is updated before we render.
Because getDerivedStateFromProps is called on every component render, not just when our props actually change, it's a good idea to use it only with React.PureComponent and to make sure we aren't recalculating stuff too often.
Use memoization helpers, check for actual changes before updating, stuff like that.
Practical exercise
Update our scatterplot so it can deal with resizing and updating data.
Steps 👇
- add an interaction that resizes the scatterplot
- move scales to state
- update scales in
getDerivedStateFromProps - use
PureComponent - add data changes
Making our component more flexible with render props
Our scatterplot doesn't look quite as nice as my screenshot earlier. That's because it's using regular SVG circles with no styling.
What if we wanted to render beautiful circles? Or stars? Or maybe something else entirely?
We can use render props to give users of our scatterplot component the power to define how they want datapoints to render. 😱
You can think of it as a sort of inversion of control, another buzzword I've heard is "slots", or renderless components. The idea is that one of our props accepts a React component.
We then use that prop to render our datapoints.
It looks a little like this 👇
<Scatterplot
	x={10} y={10}
	data={data}
	datapoint={(props) => <Datapoint {...props} />}
>
What's more, we can add interactions and other useful stuff to our <Datapoint> and <Scatterplot> doesn't have to know anything about it. All the scatterplot cares about is rendering two axes and a bunch of datapoints.
Practical exercise
Let's use the render prop approach to make our scatterplot more reusable.
Steps 👇
- accept a render prop
- use it to render datapoints
- make datapoint component look nice
- add a mouseover effect
About server-side-rendering SSR
You can use the full feature integration approach to support server-side rendering of your D3 charts. Because React handles the DOM and D3 handles the data, you can safely render on the server.
Here's the general approach 👇
- You hit reload
- Server reads
index.htmlfrom create-react-app - Server reads local CSV file with data
- Server renders
<App />into root HTML element - Server sends the full
index.htmlto your browser - Browser shows HTML with the chart
- Browser loads remote CSV file with data
- Browser runs
ReactDOM.hydrate()to render<App /> <App />takes over the DOM and becomes a normal webapp
Some parts of this are efficient.
ReactDOM.hydrate avoids re-rendering parts of the DOM that were already rendered by your server. In our case that's everything except the axes.
Some parts of this are inefficient.
The server shouldn't need to read the CSV and HTML files on every request. You could do that on startup and save the strings in a variable. They're static.
We're also rendering <App /> and running all of our React code twice. But this doesn't need to happen every time on the server. Cache that stuff!
Adapting your React D3 app to server-side
Adjusting to server-side rendering requires a small mind shift in the way you build your chart. Usually I like to use componentDidMount in the <App /> component to load data. Until data loads the app renders a null, after that it returns a chart component.
This makes apps easy to build and avoids issues with undefined data when rendering.
But it throws away all benefits of server-side rendering. With the componentDidMount approach, you're loading the fully rendered chart, replacing it with an empty component, then re-rendering it once data loads on the client.

Here's what you do instead: Accept data as props. Only load in componentDidMount if no data was given.
Like this 👇
class App extends Component {
    constructor(props) {
        super(props);

        this.state = {
            data: (props.data || []).map(this.rowParse)
        };
    }

    dateParse = d3.timeParse("%d %b %Y");

    rowParse = ({ date, time, runner }) => ({
        date: this.dateParse(date),
        time: time
            .split(":")
            .map(Number)
            .reverse()
            .reduce((t, n, i) => (i > 0 ? t + n * 60 ** i : n)),
        runner
    });

    componentDidMount() {
        if (!this.state.data.length) {
            d3
                .csv(
                    "https://raw.githubusercontent.com/Swizec/server-side-d3-poc/master/src/data.csv"
                )
                .row(this.rowParse)
                .get(data => this.setState({ data }));
        }
    }

    // render stuff
}
In the constructor we copy data from props into state. That's because components that load their own data usually keep it in state and putting it there means fewer changes to the rest of your code.
rowParse is a helper method that turns individual rows from CVS strings into correct data types. Dates for date, seconds for time to win the marathon, and runner stays a string.
In componentDidMount we now check if data is already present. If it isn't, we load it and everything works the same as it always has.
Hydrate after data loads
The final piece of the puzzle is hydrating your app after your data is done loading. You're already showing a chart, there's no need to be hasty and ReactDOM.hydrate as soon as your JavaScript loads.
You can't detect that your component already had children and avoid replacing them until you're ready. Instead, you can wait to hydrate in the first place.
d3
    .csv(
        "https://raw.githubusercontent.com/Swizec/server-side-d3-poc/master/src/data.csv",
        this.rowParse
    )
    .then(data =>
        ReactDOM.hydrate(<App data={data} />, document.getElementById("root"))
    );
And you have solved the Flash of Doom seen in most D3 charts. 🤘
Using React Hooks
Like we mentioned earlier, React Hooks are a new way of writing React components introduced in React 16.8. They give the same capabilities we used to have in class-based components to functional componenets as well.
You can have state, side-effects, memoization, etc. You can even compose them, buidl your own, and share logic between components. It's pretty great.
The two hooks you'll use most are:
useStatefor local stateuseEffectfor running code on updates
The hook most useful for D3 integration is useMemo. Let's rewrite my Scatterplot example with hooks and I'll explain how it all works.