React for Data Visualization (with D3) - workshop by Swizec
reactd3workshop.com

Hello friend 👋
Welcome to Swizec's React for Data Visualization (with D3) workshop.
Today you're in for a treat. You're going to build a data visualization and learn about the correlation between dog size, intelligence, and weight. Very important data science!.
While you do that, you'll learn enough D3 to understand any example out there, a few tricks to quickly meet your deadlines, a scalable approach to dataviz components your whole team can understand, and a bunch of animation stuff. Because animation is cool and gets you likes on Twitter.
You can access this page forever. It's yours to keep and use as a reference when you work. I make tweaks every time I give a new workshop.
To get the most out of today's workshop, you should be familiar with 👇
- React
- ideas behind componentization
- stateful/declarative rendering
- JSX
- modern ES6+ syntax
- component lifecycles
But fear not!
I am here to guide you. We'll go through everything together.
Your day is structured as a codealong.
You'll hear some theory, then we'll walk through some code, you'll do an exercise, then we solve it together. Everything builds towards the final dashboard 👉 a set of scatterplots that work together.
We're gonna keep it simple. React, D3, and Chroma. No Redux or 3rd party visualization libraries. Our goal is to really understand how things work, not to talk about a thousand libraries you'll forget by tomorrow.
Question for you ❓
What do engineering salaries, an 1854 cholera outbreak, and T. Rex have in common?
Our goal today
Think of this as our setlist 🤘
Our goal today is to get you comfortable with modern React, understand D3, and have the wisdom to choose the right approach to solve your specific challenges.
- ❓ why dataviz? why react? why d3?
- 📕 when you should or shouldn't use an existing library
- 🆕 overview of React dataviz libraries good for a quick start
- 🎓 learn to understand any D3 example out there
- 🏎 quickly integrate any D3 code in your React project
- 🔧 integrate D3 and React in a scaleable maintainable way
- 🎣 refactoring to React Hooks
- ⚒ build simple animations with transitions
- ⚒ build complex animations with a game loop
- 🎨 hybrid animations combining transitions and game loops
- 💽 connect multiple charts to the same data
Here are some cool things I've built with React & D3
These demo well, but aren't practical. Little experiments to see how far we can push this stuff :)
- Animated typing
- Canvas billiards game
- Particle generator
- Pythagorean fractal tree
- Space Invaders
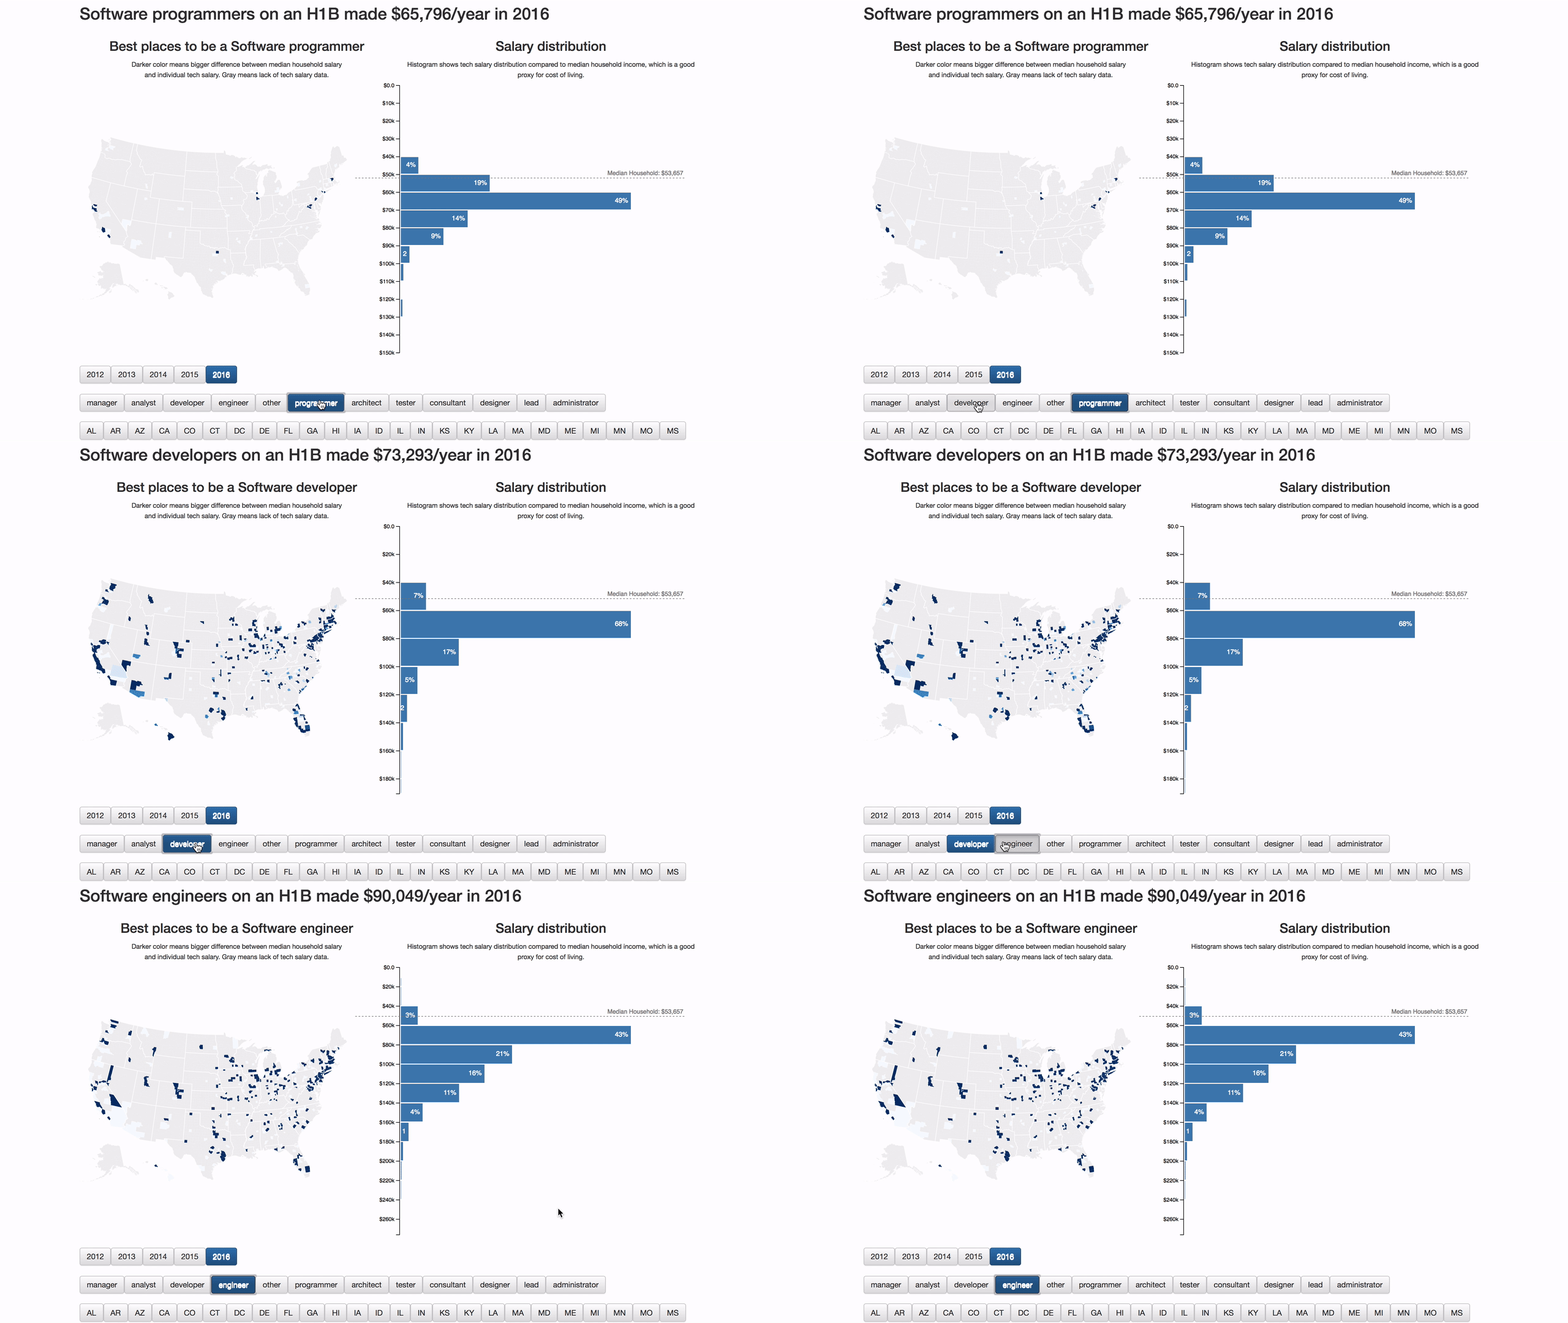
- Tech salary visualization
- A zoomable pannable map of global migrations
- An example of using flexbox in SVG
- Using React Suspense and Time Slicing in dataviz
- A connected piechart barchart viz of travel expenses
- Live donut bar chart thing
- This page :)
No, these projects are not practical, but they demo well :)
Swizec Teller
Hi, I’m Swizec Teller, a geek with a hat. I help programmers become software engineers. Through this workshop I'm going to teach you all I know about building data visualization with React & D3.
You can find out stuff about me, if you ask Google. But generally speaking I have:
- been coding for over 20 years
- writing a blog for 12 years
(please don't read early entries, I was in high school lol) - published Why Programmers Work at Night, that was fun
- published Data Visualization with D3.js, dare ask me about publishers
- self-published 3 editions of React + D3, that's been great
- created the React for Data Visualization video course
- made this interactive ES6+ cheatsheet — es2017.io
- taught in-person workshops to engineers from companies big and small
What do engineering salaries, an 1854 cholera outbreak, and T. Rex have in common?
You understand them better with datavisualization!

Salary visualization shows who and where makes the most

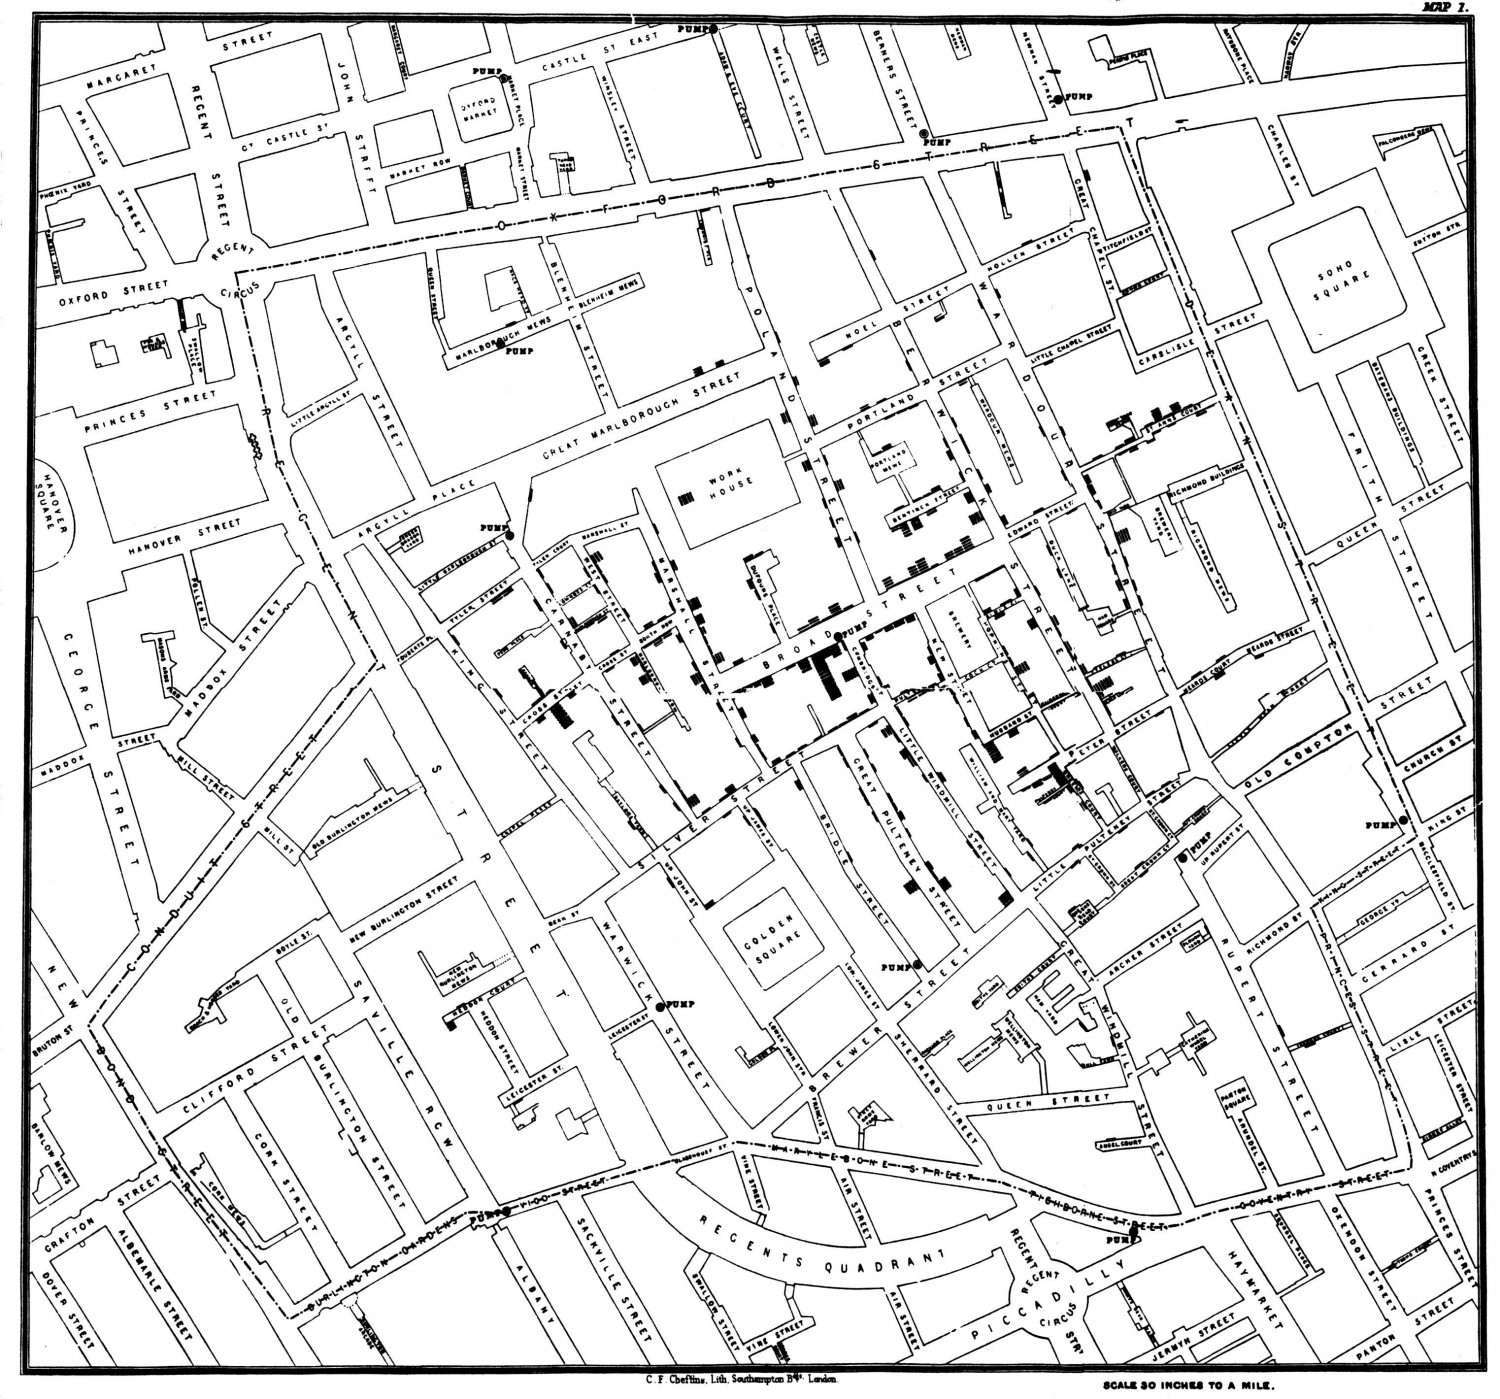
John Snow's cholera map shows link between disease and drinking water

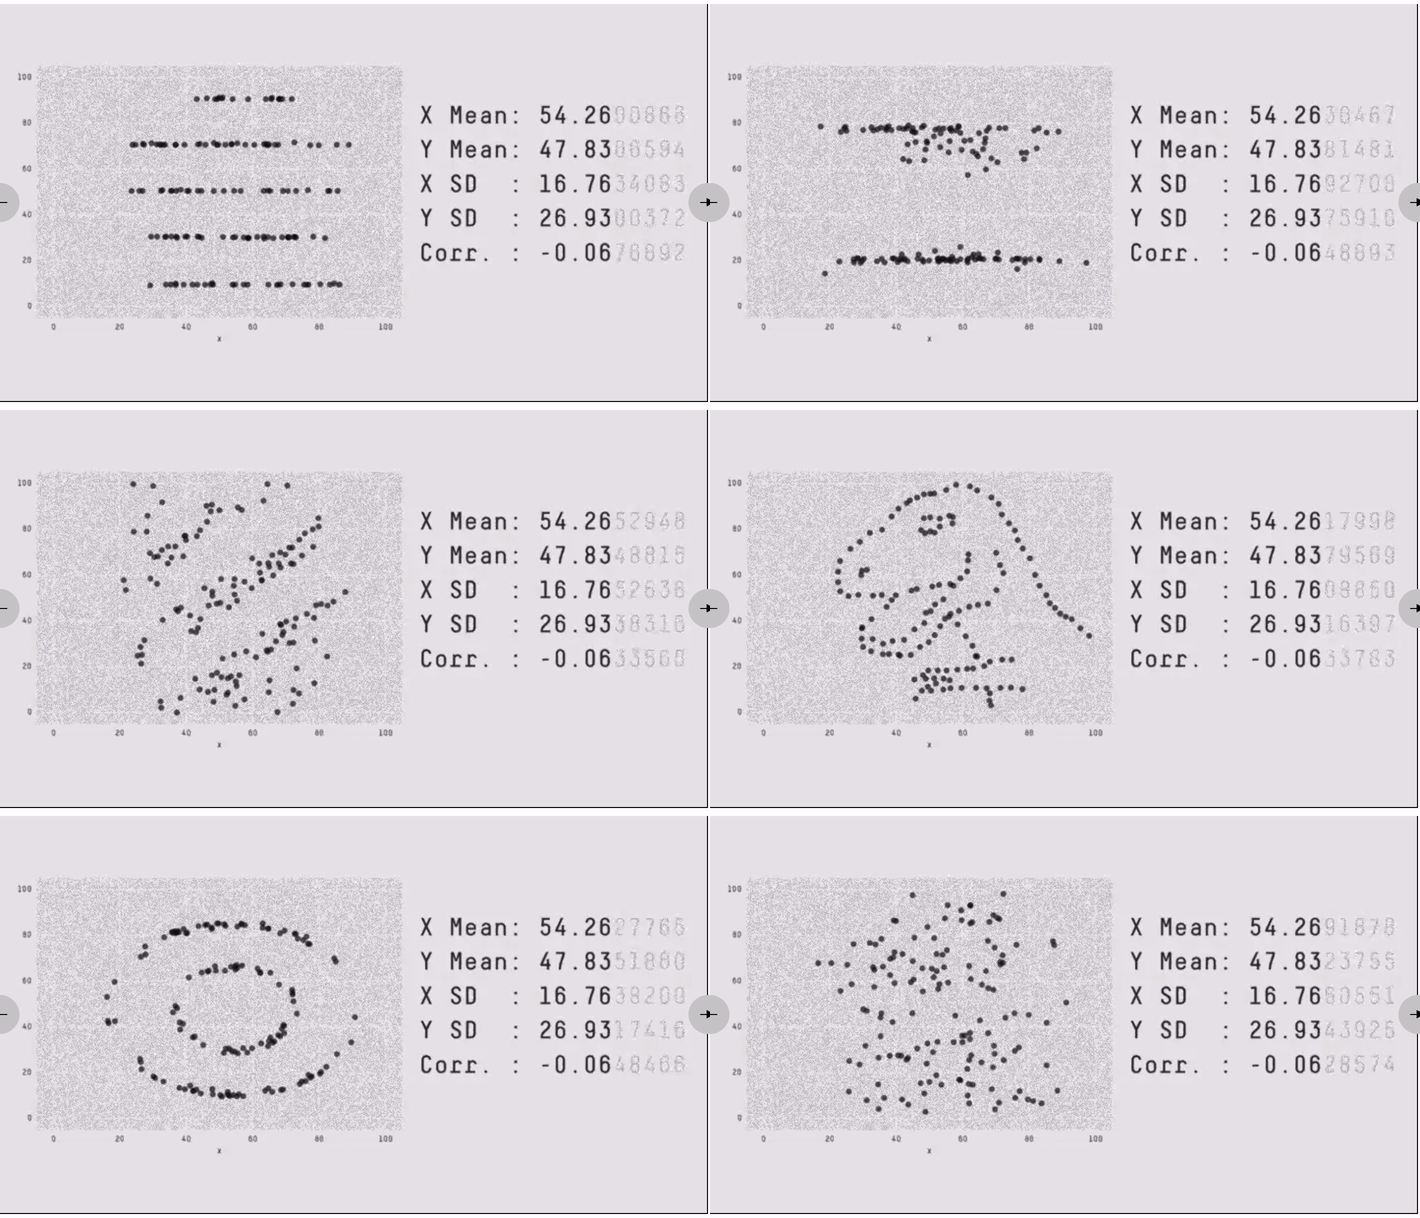
Datasaurus show summary statistics aren't the whole story.
Let's get down to business
This is an interactive workshop. If you have a question, ask. If something doesn't make sense, ask. If something is confusing, ask. If I'm not making sense, ask. If your code doesn't work, ask.
You will write code today. Some code will live on your computer, some in the browser.
We will take breaks.

But first ask yourself this: Why are you here?
Answering that question will help you get the most out of today. You can call your answer out to the group, or just think about it.
Code you'll write today works with React 16 and uses modern ES6+. We'll assume a development environment created with create-react-app. This gives us some special powers. I will point them out.
Here's our setlist for today 👇
Setlist
🎊 Fin

Before you leave please take a minute to answer this feedback form. It helps me improve.
I'll give you free access to ReactForDataViz.com in return. :)
Cheers,
~ Swizec